Debug Nodejs App in Azure App Services(windows)
Azure provides built-in diagnostics to assist with debugging Node.js applications hosted in Azure App Service Web Apps. In this article, you will learn how to
- Finding Error Info
- Useful Logs and Enable stdout/stderr logs
- Remote Debug
- Debug info in Response Header
###Finding Error Info: If you are receiving a 500 error on your node.js webapp, Here are few things which you can try to get more info
####Watch error info on web page
Include below line of code in iisnode.yml file at webapp root folder D:\home\site\wwwroot.
devErrorsEnabled: true
After including above line, restart your web app and You would start seeing something like below on web browser.
iisnode encountered an error when processing the request.

 HRESULT: 0x6d
 HTTP status: 500
 HTTP subStatus: 1013
 HTTP reason: Internal Server Error
Details on status and substatus codes https://azure.microsoft.com/en-us/documentation/articles/app-service-web-nodejs-best-practices-and-troubleshoot-guide/#iisnode-http-status-and-substatus
####Using Failed request tracing in azure webapps
- Select your web app in Azure portal.
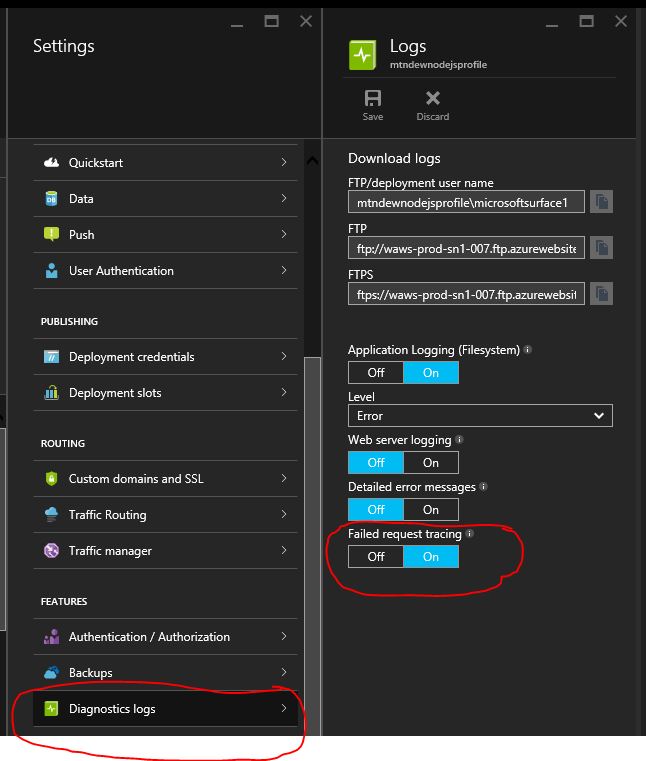
- Click on Diagnostic logs in webapp settings and Turn On Failed Request Tracing in Diagnostic Logs Tab.
- After turning on Failed Request Tracing, Access your error page in browser.
- This would create new folders(W3SV**) containing failed request logs @
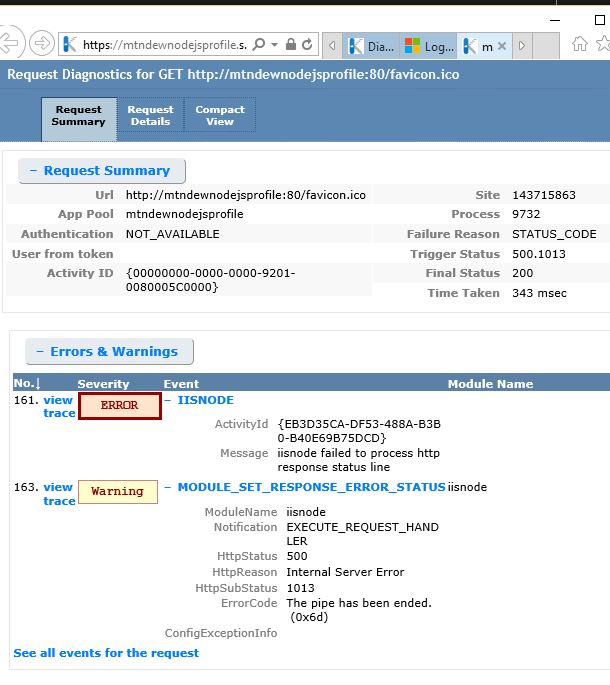
D:\home\LogFiles\in kudu console(https://<Your_Website_name>.scm.azurewebsites.net/DebugConsole). - Failed request logs would provide you more meaningful info about application error. Below is a sample screenshot
###Useful Logs :
To Troubleshoot above issue, below logs may help you
Uncaught Exception: All uncaught exceptions are by default written to logging-errors.txt file in D:\home\LogFiles\Application folder. You can view them using kudu console(https://Your_Webapp_name.scm.azurewebsites.net/DebugConsole).

XXX-stdout-xxx.txt file @ D:\home\LogFiles\Application folder
stderror: console.error(“error content”)
Standard Error Content would be visible in XXX-stderr-xxx.txt file @ D:\home\LogFiles\Application folder
You can turn-on these stdout and stderr using below two ways
####Using iisnode.yml file :
Include below line of code in iisnode.yml file at webapp root folder(D:\home\site\wwwroot).
loggingEnabled: true
####Using Azure Portal :
- Select your web app in Azure portal(https://ms.portal.azure.com/).
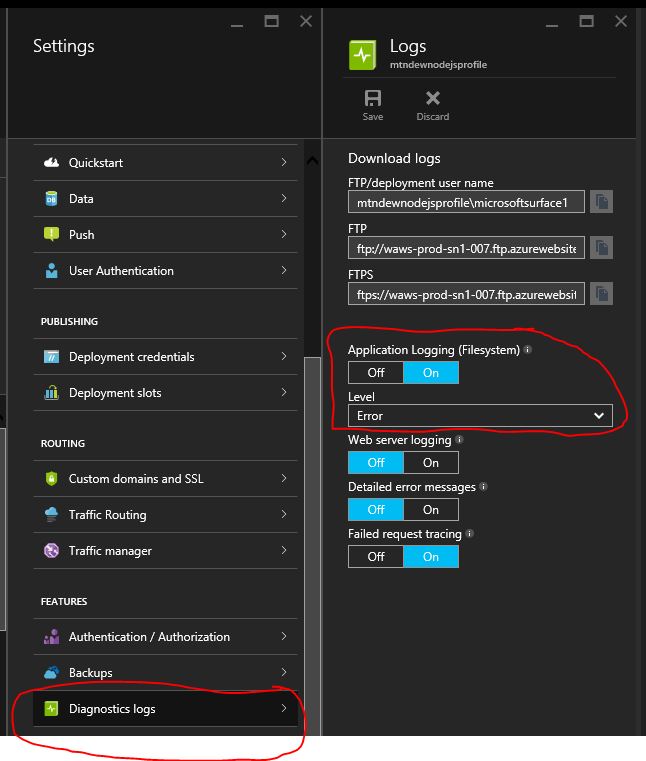
- Click on Diagnostic logs in settings option and
- Turn On Application logging in Diagnostic Logs Tab.
###Remote debug :
Below content explains how to remotely debug your Node.js application deployed on Azure Web Apps using the node-inspector debugger.
- Enter below line of code in iisnode.yml file at webapp root folder(D:\home\site\wwwroot).
debuggingEnabled: true - Check if your web.config file has below rule, else Include it. ```
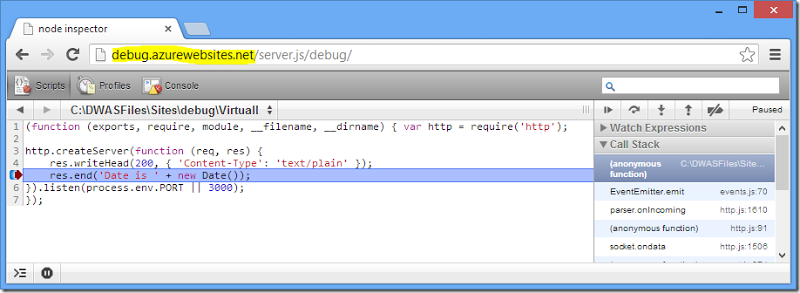
3) Navigate to `http://your_app_name.azurewebsites.net/server.js/debug`.This should bring up the familiar node-inspector interface for your application, which allows you to set breakpoints, inspect code, etc

For Advanced configuration on using custom debug url, please refer http://tomasz.janczuk.org/2013/07/debug-nodejs-applications-in-windows.html
###Debug info in Response Header:
1. Enter below line of code in iisnode.yml file at webapp root folder(`D:\home\site\wwwroot`).
debugHeaderEnabled: true
After making above change you would see a url in each response header as in below screen shot. It would provide us insights into state of node.js application.

**Sample Url :**
http://bit.ly/NsU2nd#iisnode_ver=0.2.19&node=node.exe&dns=RD000D3A7037D6&worker_pid=6056&node_pid=2556&worker_mem_ws=9676&worker_mem_pagefile=31928&node_mem_ws=29872&node_mem_pagefile=29372&app_processes=1&process_active_req=1&app_active_req=1&worker_total_req=21&np_retry=0&req_time=221&hresult=0 ``` Please find more details @ http://tomasz.janczuk.org/2012/11/diagnose-nodejs-apps-hosted-in-iis-with.html


