Nodejs App Performance Tweaks - Azure App Services (Windows)
Node.js is a JavaScript runtime built on Chrome’s V8 JavaScript engine. Node.js uses an event-driven, non-blocking I/O model that makes it lightweight and efficient.
At some point of your application lifecycle you might end-up with performance issue in any web application. This blog would help you fix such issue on nodejs app hosted in Azure App Services.
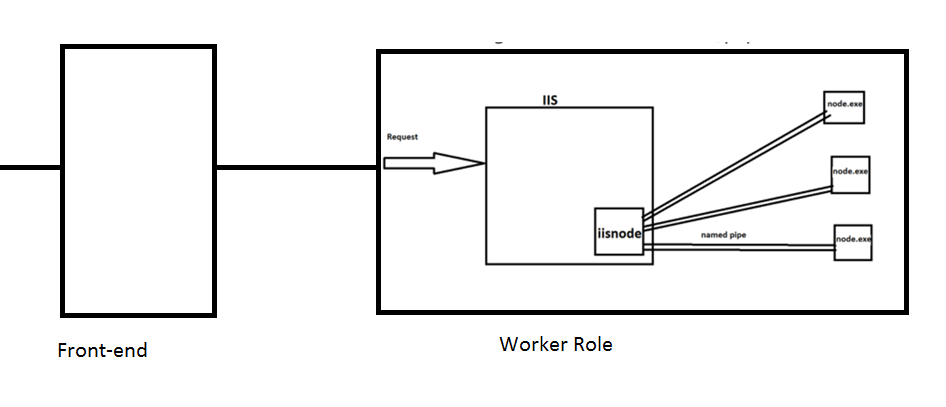
As i have explained in Nodejs Architecture Blog, Azure App services has IIS which makes named pipe connection with node.exe using iisnode to server requests.

These are the three main places where your app can experience bottleneck
- While transferring request to app instance(Front-end to worker Instance/ Before reaching IIS in worker role - happens very rare).
- Delay in IISnode making named-pipe connection with node.exe(most common in production apps).
- CPU intensive work in Nodejs Code.
First Scenario is very rare.
Useful Tools/logs
- Use New Relic to monitor application real time. More info @ https://newrelic.com/nodejs
- Gives full picture of nodejs applicaiton
- Response time for your applications
- Time taken by database and others.
- Finding Memory Leaks and CPU Usage - Link
- Check Failed Request Tracing/ FREB logs
- Navigate to your web.config file and add below lines of code. This would help you trace all the requests running slow. ```
### Performance Tweaks

#### Increase number of node.exe's per instance:
By Default, every app instance would use only one node.exe process in Azure App Service. Let's say if you are on a medium/Large instance of app service plan(with >1 core processor) than you might not be fully utilizing machine. To increase number of node.exe's per instance,

* Create a iisnode.yml file in app root folder and add below line of code
nodeProcessCountPerApplication:0
**nodeProcessCountPerApplication**
This setting controls the number of node processes that are launched per IIS application. Default value is 1. You can launch as many node.exe’s as your VM core count by setting this to 0. Recommended value is 0 for most application so you can utilize all of the cores on your machine. Node.exe is single threaded so one node.exe will consume a maximum of 1 core and to get maximum performance out of your node application you would want to utilize all cores.

#### Disable Session Affinity (Sharing load with all serves equally)

If you have scaled-out your app to more than one instance. You can turn-off session affinity which might help overload issues . More details on this can be found at [Disable Session affinity cookie (ARR cookie) for Azure web apps](https://blogs.msdn.microsoft.com/appserviceteam/2016/05/16/disable-session-affinity-cookie-arr-cookie-for-azure-web-apps/)

#### Check if issue is due to third-party services/database transactions.
If you use newrelic, it would provide time spent on each query to database which might help in this case.

#### Use Browser Cache
Refer [Enable Browser Cache](/enable-browser-cache-in-azure-web-apps-windows/)

#### Serve Static files at IIS level/ Use CDN
Check if your web.config file has a Static Content rule and make sure to serve all static files at IIS level.
In General Scenario,
**url hits IIS -> url navigates to IISNODE -> response is fetched for that url from node.exe**
By Adding Static Content rule,
**url hits IIS -> IIS responds with data (aka static url’s are served by IIS and not nodejs)**

## Tools :
Use `--prof` option in iisnode.yml file to get more info
nodeProcessCommandLine : “D:\Program Files (x86)\nodejs\8.9.3\node.exe” –prof ``` Source: https://nodejs.org/en/docs/guides/simple-profiling/