Profile Python Applications in Azure App Services
Slow application performance issues tend to be challenging to troubleshoot regardless of the platform in which your application is running. This is due in great part to the sometimes random nature of these issues. These types of issues also often do not result in a specific error being logged.
If you think your Python application is running slow and takes more than few seconds to receive response. Below info may help you analyze where it’s taking longer time and also checks for memory leaks
If you are running Python App on Azure App Services(Windows). I would recommend to use HttpPlatform Handler instead of fastcgi. Follow my blogs below for details
- Django app with HttpPlatformHandler in Azure App Services (Windows)
- Running Flask app with HttpPlatformHandler in Azure App Services
####Django
Sample Project: I followed instructions in my Django blog listed above to deploy a sample app. Later I have added below two functions to calculate nth Fibonacci number.
def fibnonci_normal(n):
    if n == 0:
        return 0
    elif n == 1:
        return 1
    else:
        return fibnonci_normal(n - 1) + fibnonci_normal(n - 2)

def fibnonci_easy(n):
    return ((1 + sqrt(5))**n - (1 - sqrt(5))**n) / (2**n * sqrt(5))
As you can see below, each request takes longer with higher the number of query param.
With below profilers we would try to find where our web app is spending its time and catch Fibonacci functions we included.
1) Pyinstrument: A Python profiler that records the call stack of the executing code, instead of just the final function in it
- Install Pyinstrument using pip and create a
profilesfolder in wwwroot. - Add below two variables to settings.py
PYINSTRUMENT_PROFILE_DIR = 'profiles' PYINSTRUMENT_USE_SIGNAL = False - Add
pyinstrument.middleware.ProfilerMiddlewareto MIDDLEWARE_CLASSES - There is a known issue in Pyinstrument while running in newer versions of Django. I have sent a Pull request that should fix this. Meanwhile make these changes manually in
D:\home\Python27\Lib\site-packages\pyinstrument\middleware.pyfile
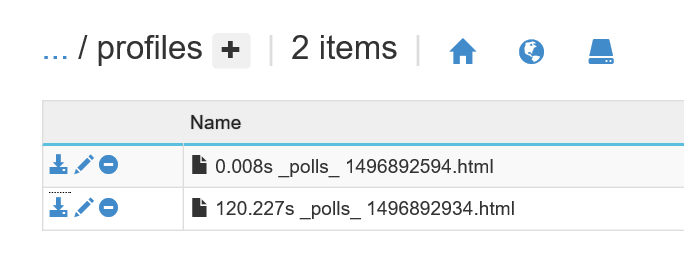
Above changes would write .html files in profiles folder which we created earlier in wwwroot folder
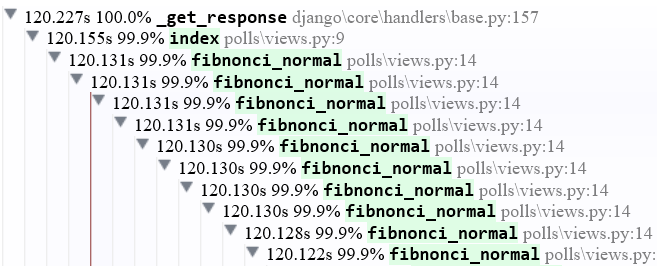
Open .html files in your favorite browser and you should see something like below which should help you
2) Silk: A live profiling and inspection tool for the Django framework. Silk intercepts and stores HTTP requests and database queries before presenting them in a user interface for further inspection.
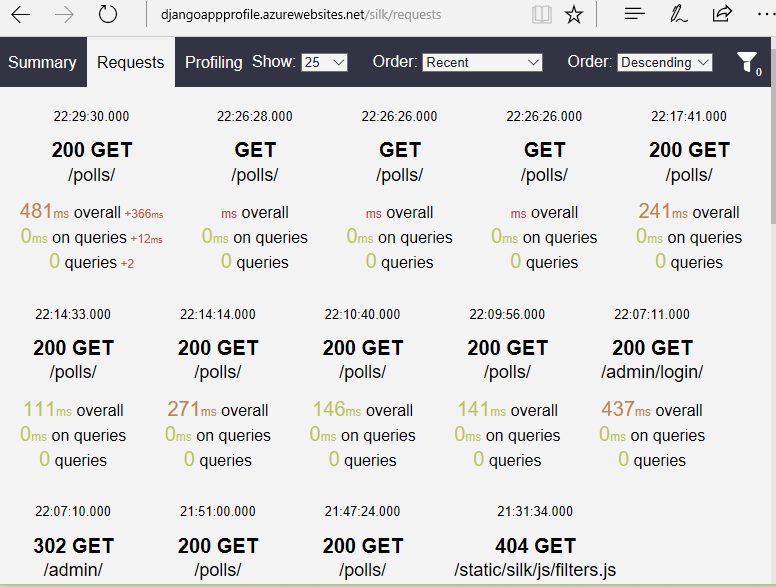
Below is the sample screenshot of all the requests I had and time taken for each. None of my url’s were interacting with database so queries show 0ms.
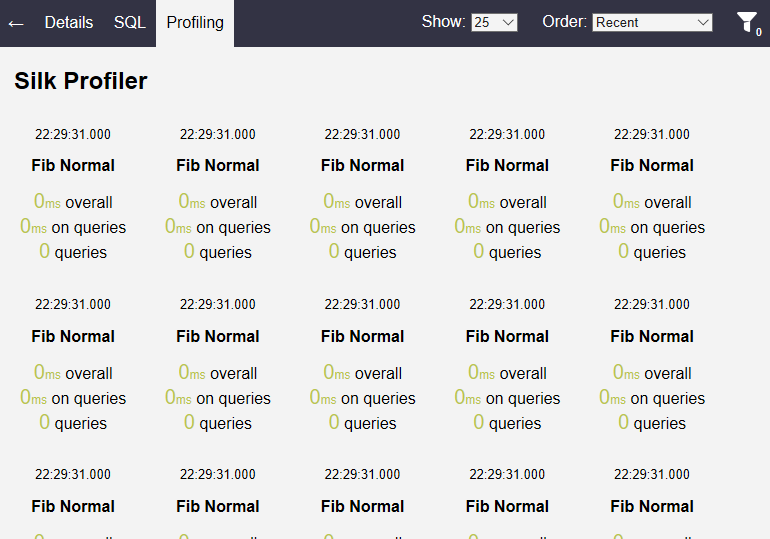
If you click on a request, it would take you to individual request level details and with profiling enabled using decorators it would provide time spent at each function level.
You can follow steps @ https://github.com/django-silk/silk to configure it. Their documentation is good and it was really easy.
3) django-dowser : This is based on dozer that can be used directly with Django app, except that this module gives you option to filter based on number of objects (issue tracking it). you might have to make little changes in original module and use below to install module instead of normal pip install from PyPl
pip install git+git://github.com/munhitsu/django-dowser.git
Other Approaches, I haven’t tried and looks promising
- django-debug-toolbar
- pyringe (stale project but liked idea of attaching to process)
- objgraph
- Pympler
- guppy
####Flask ProfilerMiddleware: Simple WSGI profiler middleware for finding bottlenecks in Flask web application.
Below is my sample Flask App using ProfilerMiddleware. It generates pstat files in profiles folder, later can be visualized using tools like snakeviz, runsnakerun.
from flask import Flask
from werkzeug.contrib.profiler import ProfilerMiddleware

app = Flask(__name__)

@app.route("/")
def hello():
    fibnonci_normal(10)
    return "Hello World!"

def fibnonci_normal(n):
    if n == 0:
        return 0
    elif n == 1:
        return 1
    else:
        return fibnonci_normal(n - 1) + fibnonci_normal(n - 2)

app = ProfilerMiddleware(app,profile_dir="profiles")

if __name__ == "__main__":
    app.run()
If you remove profile_dir, it would write logs to STDOUT. Check their documentation on details for adding restrictions/sort data.
Other Approaches, I haven’t tried and looks promising
- flask-debugtoolbar
- dozer (Works for Django too)


